Lyme On The Rise:
A Look At The Numbers
Forty years ago Lyme Disease didn't even have a name. Today, the tick-borne disease infects up to 300,000 people each year and has greatly expanded its range beyond the small Connecticut town where it was first identified in 1975. While the data doesn't go that far back, the numbers from the last 15 years paint a disconcerting picture of a disease on the rise.
The story of the growth of Lyme Disease is really the story of the deer tick, the primary vector for the disease and the beneficiary of a warming climate and increasingly fragmented forests. Where the deer tick and its small mammal hosts are found, so too is Lyme Disease.
NOTE: The below data represents only the reported cases, which the CDC estimates could be as few as 10 percent of all infections. For more information on this data, see this CDC explanation.
Northern New England: From (Near) Zero To Endemic
New Hampshire has been hit the hardest in the last 14 years with the highest incident and growth rates of any state in the country, while Massachusetts has had by far the most cases each year in the region. Rhode Island was the only state in New England to see its growth rate go down and it has had the fewest cases of all the New England states.
Northern New England
Choose A Region To Graph:
New England Statistics
| State | Incident Rate | Growth Rate | 1999 Cases | 2012 Cases |
|---|---|---|---|---|
| New Hampshire | 75.9 | 29.5% | 27 | 1,002 |
| Maine | 66.6 | 24.5% | 41 | 885 |
| Vermont | 61.7 | 21.3% | 26 | 386 |
| Massachusetts | 51.1 | 11.0% | 787 | 3,396 |
| Connecticut | 46.0 | 1.2% | * | 1,653 |
| Rhode Island | 12.7 | -9.6% | 546 | 133 |
*Reliable data from Connecticut prior to 2003 is not available.
Definitions
Incident Rate
Confirmed cases per 100,000 population based on 2012 data
Growth Rate
The exponential growth rate. Connecticut's growth rate was found for 2003-2012, all other states from 1999-2012.
Vermont: Facing A New Reality
Vermont's total number of cases doesn't compare to some of its more populous neighbors, but with the third-highest incident and growth rates in the nation, Vermonters now need to be tick aware and learn both how to avoid being bitten and what to do in the event of a bite.

What About The Rest Of The Country?
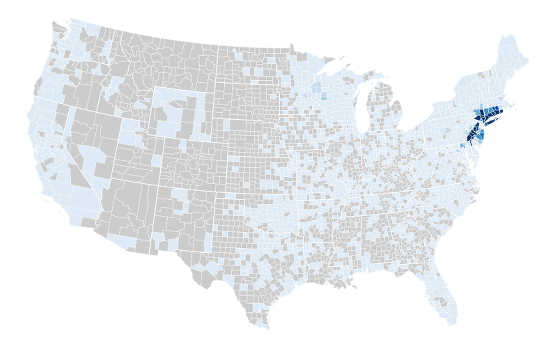
Lyme Disease is largely restricted to the Northeast, the Mid-Atlantic and the Upper Midwest, with 95 percent of cases coming from just 13 states. Pennsylvania has the most cases every year—over 5,000 probable cases in 2012. Outside of the Northeast cluster, Wisconsin has the largest number of probable cases in 2012 with 1,766.
While the deer tick's range extends into the South, Lyme Disease hasn't proliferated in the region the way that it has in the Northeast and Upper Midwest. This is due to the ticks' different feeding habits in the southern part of their range.
Since the data on reported cases is sourced by state of residence, not state of exposure, it is difficult to determine the exact origin of many of the cases but it is reasonable to assume that over-reporting occurs in the disease's non-endemic areas, resulting in an inflated number of reported cases in places where the disease is less likely to be contracted, like the West.
Confirmed Cases By County
1992-1996

1997-2001

2002-2006

2007-2011
A Note About The Data
Due to reporting methods and the limitations of surveillance data, discrepancies between figures exist, even in this report.
In the table of New England states, the number of cases in 2012 is reported as 386 while in the map of Vermont counties, the 2012 figure is listed as 367. The figure in the table represents the number of confirmed cases in Vermont, regardless of origin. In the map of Vermont, the figure used is the number of confirmed and probable cases of Vermont origin.
Since more accurate information was available for Vermont, that data was used to provide the most accurate picture of Vermont's Lyme Disease statistics. The same data wasn't available for all New England states, so in comparing Vermont to the other New England states, the more general figures were used.
For more on the complexities and limitations of this data, see this CDC explanation.
Updates:
July 23, 2014: Added note below introductory paragraph clarifying reported vs. total cases